No products in the cart.
Profitable 52 Patterns Available, Entry Point and Stop Loss Point Added !!! 📊📉📈✔✔✔
Candlestick and chart patterns Available in Hindi
Premium ebook Lifetime Validity📈✔
Advanced Highly profitable trading patterns 📊📈
Rs.199 only✔📊📊📊
Candlestick And Chart Pattern book Apply For All Market segments Like...
⭐𝙄𝙣𝙩𝙧𝙖𝙙𝙖𝙮 𝙩𝙧𝙖𝙙𝙞𝙣𝙜
⭐𝙁𝙪𝙩𝙪𝙧𝙚 𝙢𝙖𝙧𝙠𝙚𝙩
⭐𝙊𝙥𝙩𝙞𝙤𝙣 𝙩𝙧𝙖𝙙𝙞𝙣𝙜
⭐𝘾𝙪𝙧𝙧𝙚𝙣𝙘𝙮 𝙩𝙧𝙖𝙙𝙞𝙣𝙜
⭐𝘾𝙤𝙢𝙢𝙤𝙙𝙞𝙩𝙮 𝙢𝙖𝙧𝙠𝙚𝙩
⭐ 𝙁𝙤𝙧𝙚𝙭 𝙩𝙧𝙖𝙙𝙞𝙣𝙜…..
Backtested Strategies, Became Trade Like a Pro. 📊📉📈✔✔✔
Trading chart patterns : Total 52 strategies
TYPES OF CANDLESTICKS included in this book
1. Hammer
2. Inverted hammer
3. Gravestone doji
4. Dragonfly doji
5. Spinning top
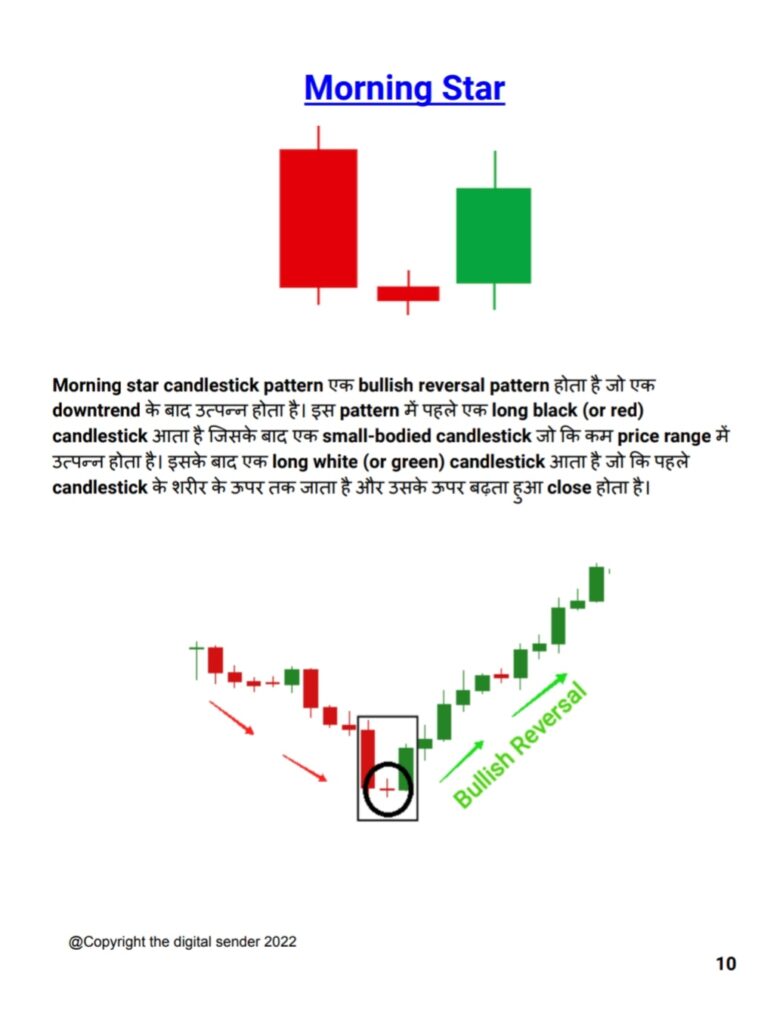
6. Morning star
7. Evening star
8. Shooting star
9. Hanging man
10. Bullish engulfing
11. Bearish engulfing
12. Tweezer bottom
13. Tweezer top
14. Bullish inside bar
15. Bearish inside bar
16. Bullish harami
17. Bearish harami
18. Three white soldiers
19. Three black crows
20. Dark cloud cover
21. Pin bar
22. Bullish piercing
23. Bullish kicker
24. Bearish kicker
25. Three outside up
26. Three outside down
27. Three inside up
28. Three inside down
29. Bullish marubozu
30. Bearish marubozu
(2) TYPES OF CHART PATTERNS
1. Double top
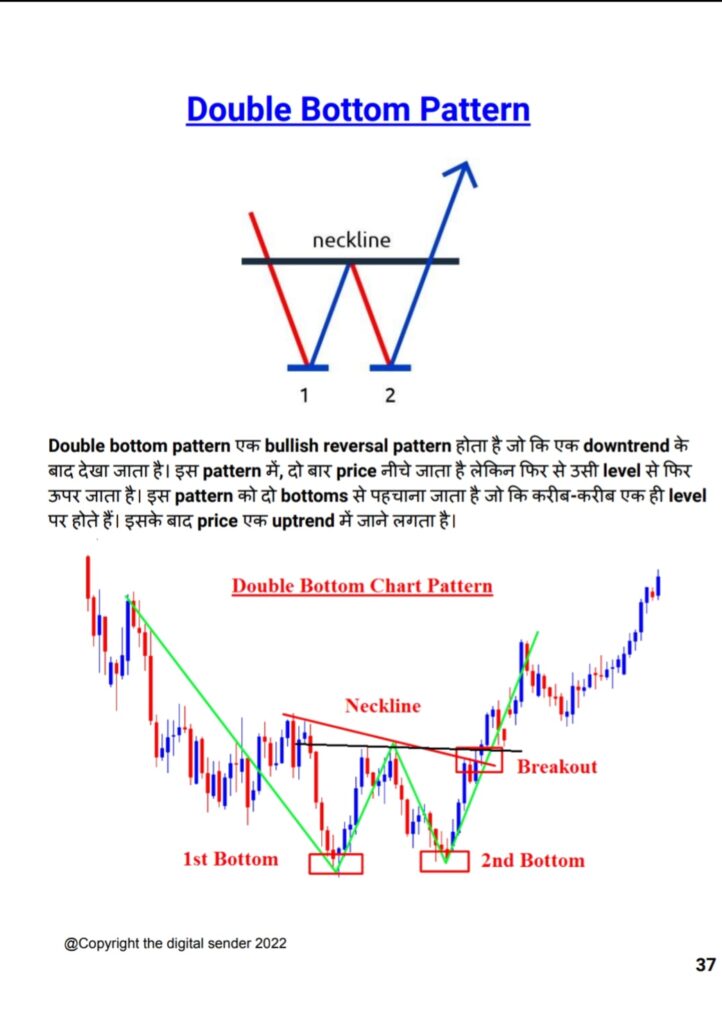
2. Double bottom
3. Triple top
4. Triple bottom
5. Bullish pennant
6. Bearish pennant
7. Bullish flag
8. Bearish flag
9. Bullish rectangle
10. Bearish rectangle
11. Rising wedge
12. Falling wedge
13. Head and shoulders
14. Inverted head and shoulders
15. Symmetrical triangle
16. Broadening triangle
17. Ascending triangle
18. Descending triangle
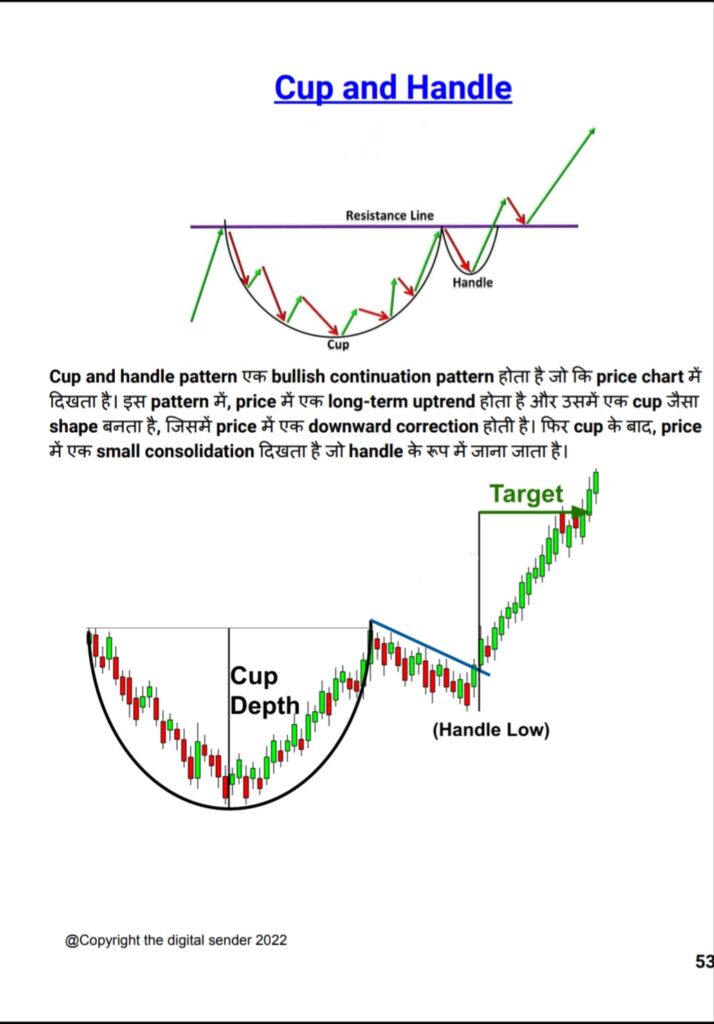
19. Cup and handle
20. Rounding bottom
21. Diamond top
22. Diamond bottom
Apply For All Market segments Like...
⭐𝙄𝙣𝙩𝙧𝙖𝙙𝙖𝙮 𝙩𝙧𝙖𝙙𝙞𝙣𝙜
⭐𝙁𝙪𝙩𝙪𝙧𝙚 𝙢𝙖𝙧𝙠𝙚𝙩
⭐𝙊𝙥𝙩𝙞𝙤𝙣 𝙩𝙧𝙖𝙙𝙞𝙣𝙜
⭐𝘾𝙪𝙧𝙧𝙚𝙣𝙘𝙮 𝙩𝙧𝙖𝙙𝙞𝙣𝙜
⭐𝘾𝙤𝙢𝙢𝙤𝙙𝙞𝙩𝙮 𝙢𝙖𝙧𝙠𝙚𝙩
⭐ 𝙁𝙤𝙧𝙚𝙭 𝙩𝙧𝙖𝙙𝙞𝙣𝙜…..
PRODUCT Description
Candlestick and chart patterns are commonly used tools in technical analysis to help traders identify potential trends and reversals in financial markets.
Candlestick patterns involve analyzing the open, high, low, and close prices of an asset over a specific time frame to identify patterns that can indicate a potential price movement. For example, a bullish engulfing pattern occurs when a small bearish candle is followed by a larger bullish candle that completely engulfs the previous candle, indicating a potential shift towards a bullish trend.
“After Payment,
you will get Download link on your Email instantly. ”
STILL HAVE QUESTIONS? WE'VE GOT YOU COVERED!
What I Will Get After Purchase?
After successful Payment You can Download All Instantly. You will be redirect automatically to another page. From there you can download All Instantly. AND,
You will get Well-Optimized PDF file automatically Just After your Purchase On your Email ID. with DOWNLOAD LINKS.
How I will get Product or Download Product?
After successful Payment You can Download All Instantly. You will be redirect automatically to another page. From there you can download All Instantly.
Is it Available Lifetime?
For your Safe side, we recommend you to download all necessary files and save it in your computer. So that you can access it anytime.
What is the best timeframe to analysis stock market ?
Intraday/Short-term/options Trading: For traders who focus on short-term price movements, time frames such as 5-minute, 15-minute, or 1-hour charts can be useful. These charts provide a detailed view of price action and are commonly used by day traders or scalpers.
Swing Trading: Swing traders typically hold positions for several days to weeks. They often use time frames like 4-hour, daily, or weekly charts to capture medium-term price swings and trends. These time frames provide a broader perspective and help identify longer-term chart patterns.
Position Trading/Investing: Investors and position traders who take a long-term view often refer to weekly or monthly charts. These time frames help identify major trends and are useful for determining long-term investment strategies.